Why ABM needs Statistical Model Checking

We are seeing a wave of research connecting macroeconomic agent-based models with empirical data. We are no longer simply matching the stylized facts (Level 1 validation) but are developing standardized and advanced methods for comparing ABM outputs to data (see here for some references). Except, somehow one thing is still missing to me, that is a consistent confidence band around estimates both transient and steady state wise. Recently on arXiv I read Automated and Distributed Statistical Analysis of Economic Agent-Based Models by Vandin et al. - its premise is to use statistical model checking for agent-based models in economics. Why is this paper awesome? Many of the techniques are quite straightforward and automated, while the benefits are a huge boost to the robustness of output results. In this post I outline why this is important (I focus on the transient analysis, and leave the steady state analysis to a later post), their method, and how we might interpret the results.
How many simulations to run?
An observation to be made: in a lot of articles the number of simulations for the Agent-based Models seem somewhat arbitrary. For instance, Poledna et al. (2020) run 500 simulations, Popoyan et al. (2020) use 150, Dosi et al. (2020) use 50. The next question is why? Most of these appear to be done ad hoc. My assumption is that it is primarily determined simply by the computational time of the model under consideration. The more complex the model, the longer it takes to generate a full simulation run, the less simulations are feasible. However, as Vandin and company point out, the choice of the number of simulations to run has a large impact on the statistical significance and robustness of the results that are obtained.
Why simulation counts matter?
The principle idea is that the more simulations you run the more robust your results. A single run may be an outlier, taking the average over many makes this less likely. Since the runs are independent of one another, the sample mean of a particular variable at each time t is an unbiased estimator of the true mean at that point. That's great, but the question about the confidence interval (or the standard deviation of that estimation remains unanswered). It is a precise estimate, but we do not know anything about its accuracy.
Does it matter? The classic answer is it depends on what the aim of the modelling exercise is. Whether the simulation averages have a low variance is an irrelevant question when its about a proof of concept or thought experiment whose purpose, in a nutshell, is to prove the existence of a phenomenon.
We do come into the need for this particular kind of robustness when we are answering questions of comparison between models. For instance, the effects of changing underlying behavioral heuristics as in Popoyan et al. (2020) or the comparison of an ABM with a DSGE model as in Poledna et al. (2020) (also done in Barde (2020) though using their own criterion). The need here is for generating trust in the results. I do not doubt the researchers have done extensive tests but it would be nice to see a similarly sized confidence-interval around all of the estimates in order to see how and where the differences play a significant role. That is to say, I would rather read that simulations were conducted to generate mean realizations at each time t where we are 95% confident that they are within a range of +/- 5% of the calculated mean. With our new-found certainty that the means are (or aren't) in a given confidence interval, we can then also easily test for a difference in means (Welch's t-test) and its associated power.
Statistical Model Checking - Automating the Choice
The contribution of Vandin et al. (2021) is less about the confidence interval itself, which is a trivial result of the law of large numbers because the underlying random seeds mean the simulations (for a given starting value) are independent. The following relation holds:
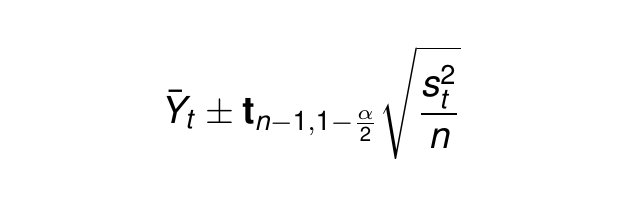
Where t is the t-statistic with d.o.f n-1, alpha is the confidence, and s is the standard deviation. The confidence interval will shrink quite slowly, in proportion to the square root of n, so excess simulations are costly but with a small benefit to the confidence.
The real contribution of Vandin is to provide a simple algorithm to continue running simulations to compute these intervals at each simulation t. This means analysis is systematic and defined by the interval size and confidence level rather only. Doing this on a limited budget of total simulation runs would be a trivial extension. Block size (how many simulations to run at a particular moment to update the confidence intervals) should likely be equal to the number of parallel simulations that you are able to run.
Their paper is not limited to this itself, as they also provide two algorithms that would allow the modeler to understand whether or not the model can reach a steady state (testing for ergodicity) and if so, how long it takes to get there.
Some thoughts on interpretation
Why is this satisfying? We can now say that the band around each of our estimates is the same size, which gives a better sense of the robustness of the outputs. All the while, we have not lost any information since we retain information on the number of simulations it took to get to such a level of confidence.
This in itself could serve as an interesting indicator of economic uncertainty. A high standard deviation (and hence number of runs until the interval is reached) implies that the outcome at these points in time are extremely sensitive to the particular random numbers generated at that step. In other words, we could be near a phase transition where we observe the "small shocks, large effects" phenomena (Bernanke). Combined with a detailed study of the phase portrait of the particular agent-based model (e.g. as in the Mark-0 of Bouchaud) this could serve as an interesting indicator for the potential of crises.
The most fruitful effect is being able to distinguish between different parameterizations, behavioral heuristics, and models, as well as the calibration of the model to the data at hand. Differences in model outputs over time can be given by the results of a test for difference in means and visual explorations can also be made more robust to the addition or subtraction of a small amount of simulation runs.
Vandin's Example and Links
In their paper, Vandin et al. actually use their MultiVeSta package on a macroeconomic ABM, that of Caiani et al. (2016), which was proposed as a baseline model (something, among the oh so many things, that I want to eventually replicate). The results:
Confidence interval sizes vary - a lot.
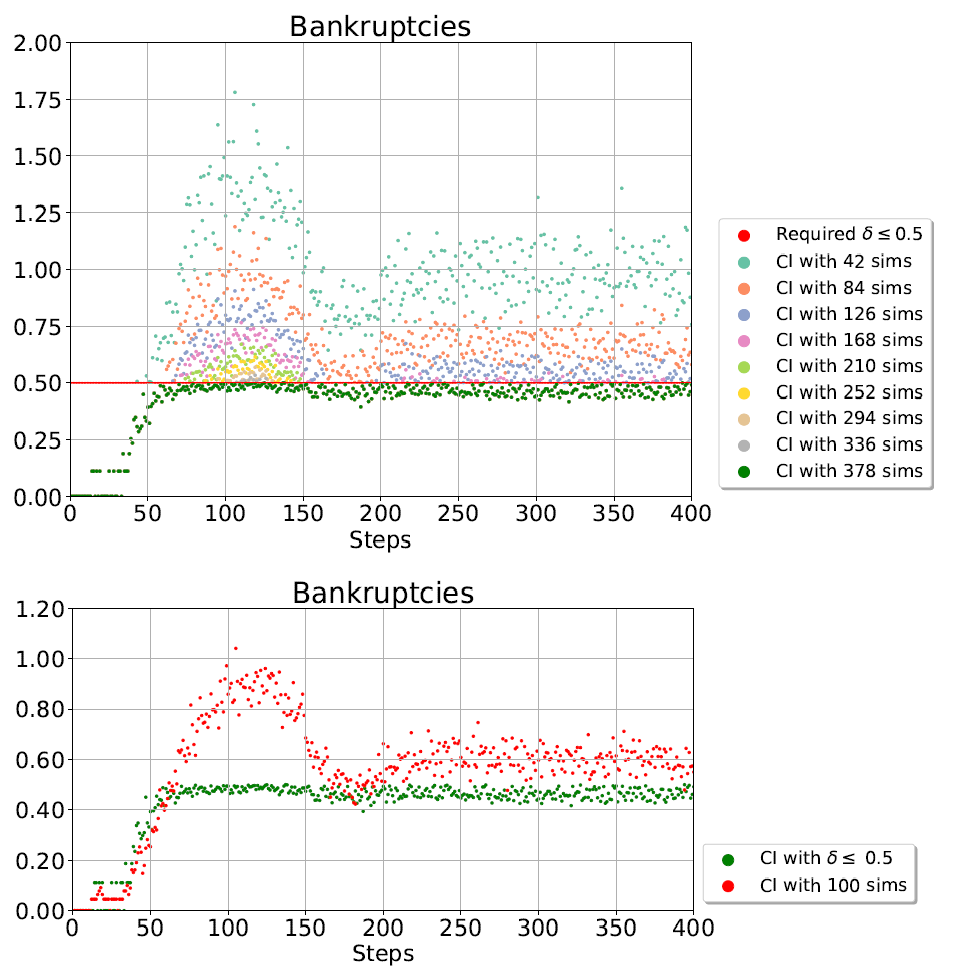
They compared the size of the confidence intervals between a fixed number of runs with those of an algorithm without a maximum number of runs. The results are quite staggering. In steps 50-100 the model has a crisis (spike in bankruptcies) and is in a steady state after period 200. The mean outcome is the same as Caiani in 2016, the confidence, much higher.
Comparing model outputs between input changes
The difference in outcome, if statistically tested, is usually done by a t-test for the average across the timespan (e.g. Popoyan et al. 2020). This is not robust to the choice in number of simulation runs or the point in time
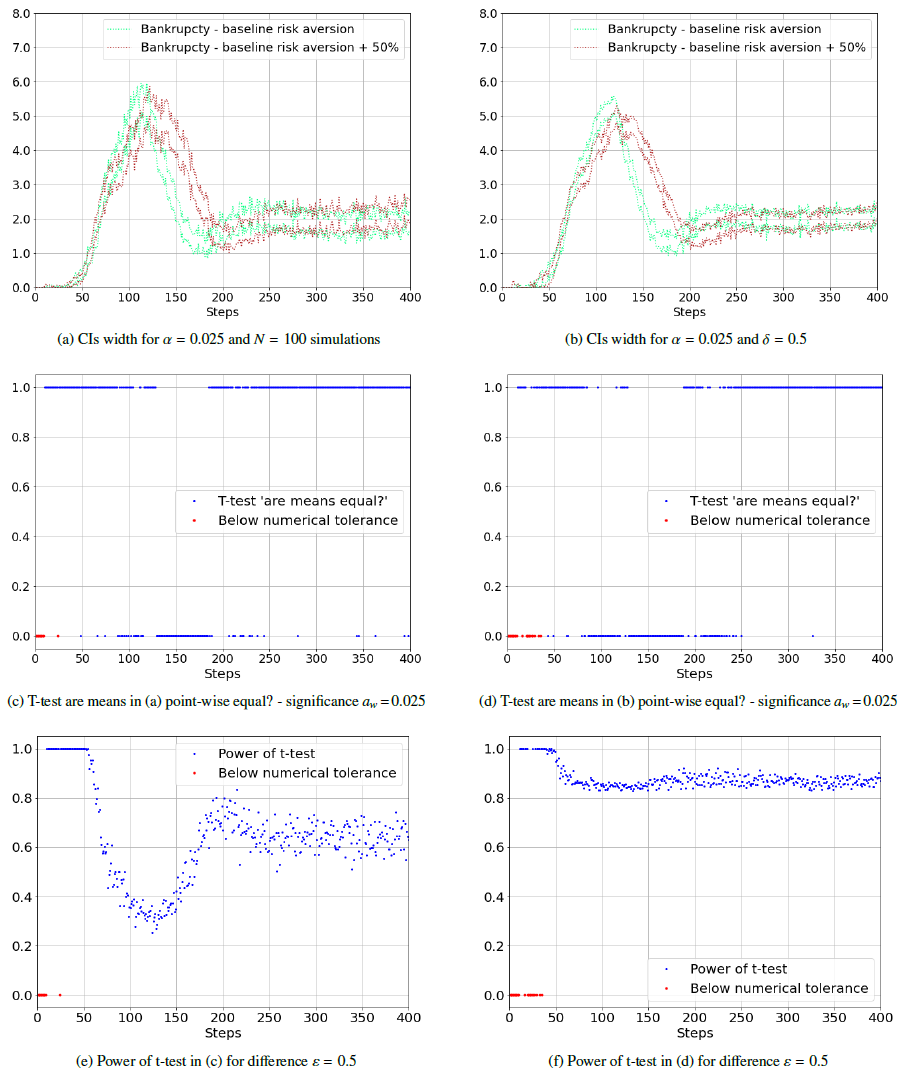
The result - with the algorithm the power of the tests is significantly higher at all periods, and there is a larger period (that of the crisis) where the means are unequal...
Final Thoughts
Vandin et al. present a very straightforward method that leads to more statistically robust results. I don't really see any reason this shouldn't be a standard.
How do you easily do this? MultiVeSta is actually a free-to-use package for multiple platforms.
** Coverimage credit: Gerd Altmann from Pixabay **